Betting on the Stimulus
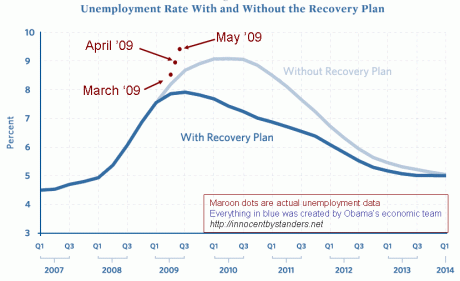
In a post from about a month ago, I noted that the Obama administration put out a prediction of what would happen if the stimulus bill was passed and if it wasn’t. They predicted a smaller bump in the unemployment rate if their stimulus plan passed. Spend the money, they said, and the pain would be eased.
Those on the Right, however, said that trying to spend our way out of this wouldn’t work, and suggested that "stimulus" spending in the 1930s put the "Great" in "Great Depression". Instead, we’d be saddled with government debt for a generation.
In that previous post, I noted that Geoff of the Innocent Bystanders blog had put up a graph showing that unemployment looked like it was about to get worse than even the Obama administration’s worst-case, no-stimulus scenario. Well, May’s numbers are in, and he’s updated the graph.
Those red dots rising up, month after month, are the actual unemployment figures. So we get record-setting debt and an unemployment curve worse than predicted for doing nothing. Government intervention is sounding worse with each passing month.
Filed under: Doug • Economics & Taxes
Like this post? Subscribe to my RSS feed and get loads more!

